
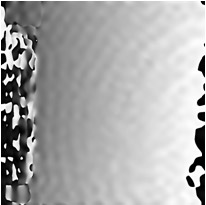
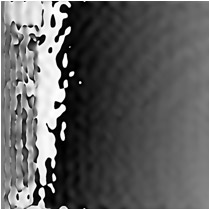
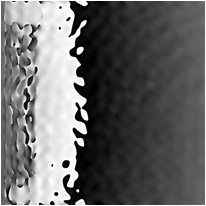
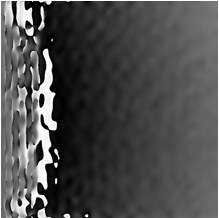
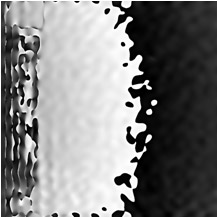
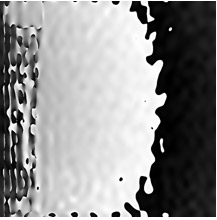
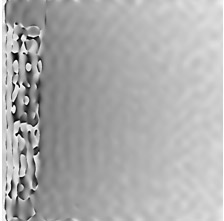
Visualization of acoustic surface waves in the lithium niobate crystal on a frequency of 17 MHz under thermal expansion of the sample.
Wave length – 0.532 µm, exposure time – 60 ps; sample surface area size – 3.84 by 3.84 mm
Interferograms obtained by means of comparing a hologram of the stall position with a series of holograms recorded consequently after loading. Time of holographing is provided under respective pictures (HH:MM:SS).
| No. 1 | No. 2 | No. 3 | No. 4 | |||
 |
 |
 |
|
 |
|
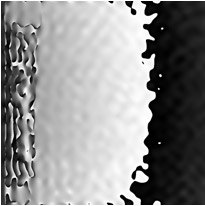 |
| 21:33:16 | 21:33:36 | 21:33:54 | 21:34:32 | |||
| No. 5 | No. 6 | No. 7 | No. 8 | |||
 |
|
 |
|
 |
|
 |
| 21:34:52 | 21:35:06 | 21:35:40 | 21:36:24 |
